ECommerce Analytics Platform
for Small Businesses
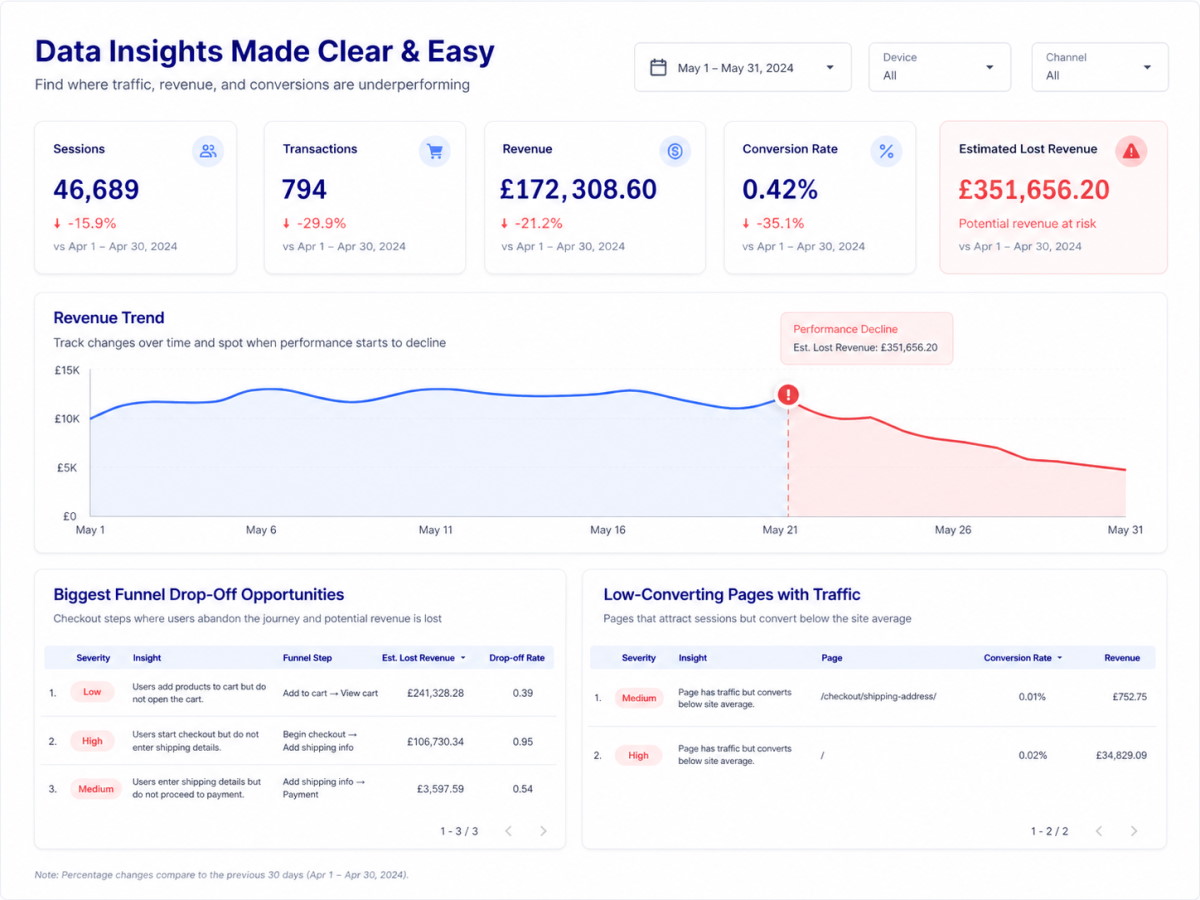
Data Insights Made
Clear & Easy
Find where your eCommerce site loses traffic, conversions, and revenue in a few clicks without digging through analytics or data visualization tools.
Explore issues, not metrics
Find where you’re losing money
Leakonic connects your ecommerce analytics data and turns it into simple, prioritized issues. Instead of configuring separate reports manually, you see what is underperforming, how serious it is, and where to focus first.
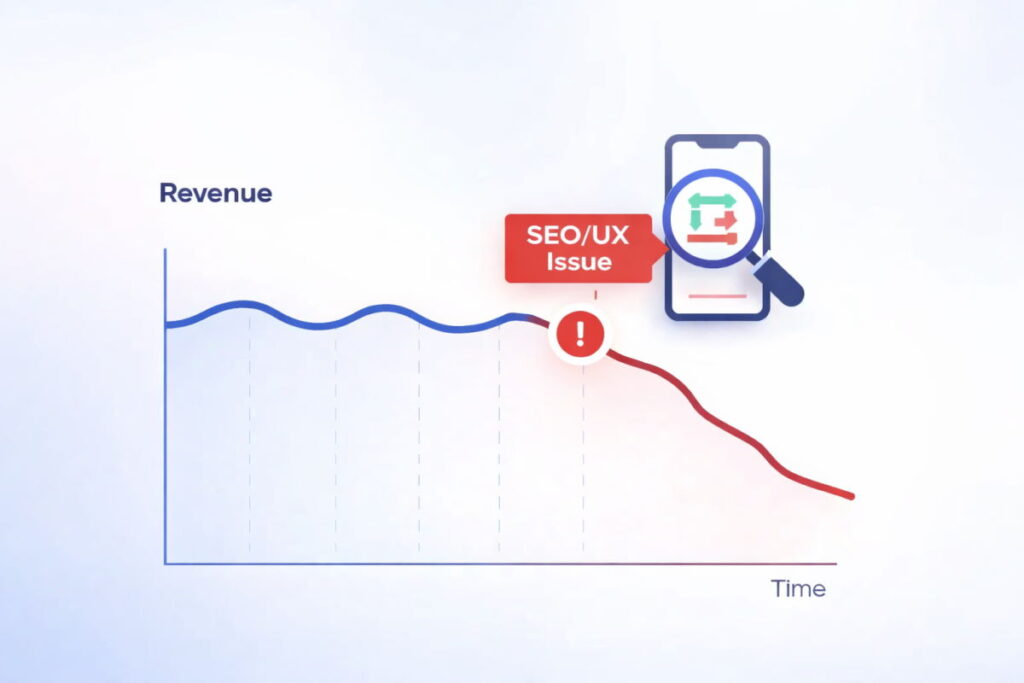
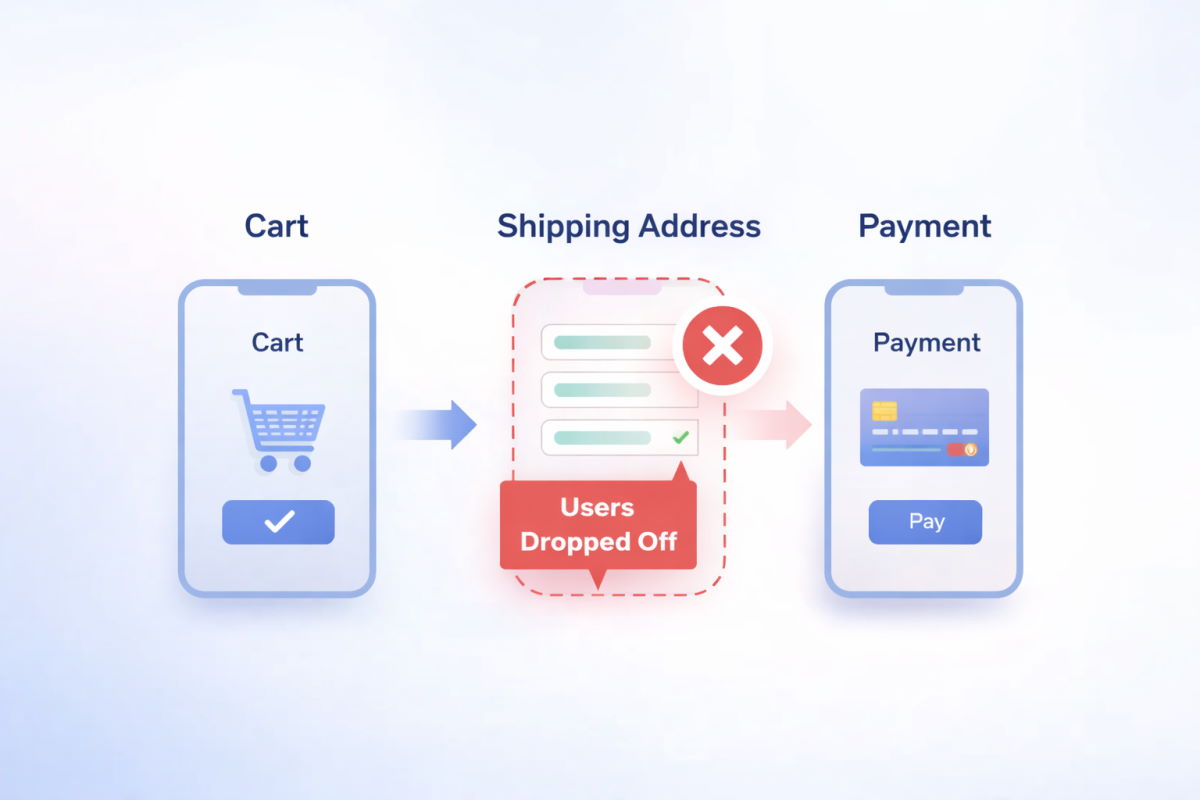
Revenue leaks
Identify funnel steps where users drop off and estimate how much revenue may be at risk.
Conversion issues
See which product, category, or checkout pages attract visitors but fail to turn them into buyers.
Traffic drops
Find pages where organic traffic, clicks, or visibility start to decline before the drop becomes obvious.
Get insights, not dashboard
From messy dashboards
to clear business issues
Ecommerce analytics platforms like GA4 show you plenty of data, charts, and reports. But first, they need to be properly configured. Then you still need to understand how to read the numbers, decide whether there is a real problem, and find where exactly it starts.
Leakonic makes this clearer. It shows where your ecommerce site is underperforming, which issue needs attention, and how much revenue may be at risk in a few clicks.
How it works
How Leakonic turns eCommerce data into insights
You do not need to be technical, write code, or build reports from scratch. Leakonic gives you the ready-to-use analysis script and report structure. You only need to paste and click a few buttons in GA4, BigQuery, and Google Data Studio (Looker Studio).
2
Collect your data
Make sure your GA4 is connected to BigQuery, so your eCommerce data is available for analysis.
→
2
Copy the script
Choose a suitable package according to your business needs. Copy the SQL script from your order with one click.
→
3
Run the query
Run the copied script inside your BigQuery project. The script prepares the tables needed for issue detection.
→
4
Connect your data
Make a copy of the ready-made Looker Studio report template. Connect the report to your BigQuery dataset.
Who it is for
Made for eCommerce teams that need answers, not more dashboards
- Small and medium eCommerce stores with stable traffic and regular sales
- Businesses using GA4 and GTM
- Online retailers that need clear issues and priorities instead of raw analytics data
- eCommerce owners and managers who need to easily get conversion insights
- Marketing agencies seeking to quickly identify site issues affecting client’s revenue
pricing
Reusable packages
Starter helps you understand why performance is dropping. Growth shows where money is leaking. Scale helps prioritize what to fix across a complex eCommerce site. All of them can be used multiple times – just rerun the script.
Revenue leaks & Funnel analysis
Starter
€99 €79*
* one-time payment
- Landing page performance
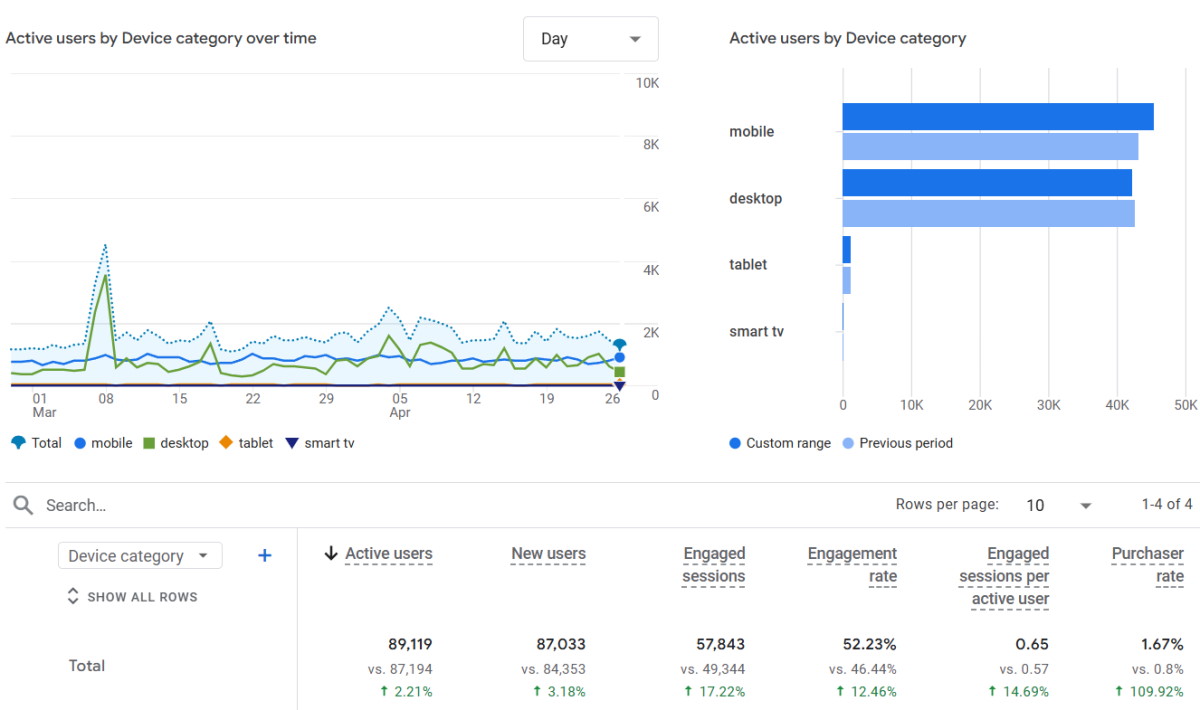
- Performance by device
- Leak signals
- Data validation
- Funnel performance
+ funnel analysis by device & SEO
Growth
€199 €159*
* one-time payment
- Landing page performance
- Performance by device
- Leak signals
- Data validation
- Funnel performance
- Funnel performance by device
- Product analysis
+ GEO & product analysis
Scale
€299 €249*
* one-time payment
- Landing page performance
- Performance by device
- Leak signals
- Basic data validation
- Funnel performance
- Enhanced data validation
- Funnel performance by device
- Product analysis
- Search engine optimization (SEO)
- Generative engine optimization (GEO)
Case study
Conversion rate increased by 110%
An online grocery store was losing revenue and could not clearly see where performance was dropping. Analytics data was fragmented, checkout behaviour was hard to analyse, and marketing decisions were not supported by reliable reporting. We helped turn unclear performance data into practical eCommerce improvements:
- Set up enhanced ecommerce tracking and regular Looker reporting
- Identified key checkout and device-level performance issues
- Redesigned checkout pages for mobile users
- Reduced unnecessary checkout steps
- Removed mandatory registration before purchase
- Added product linking blocks to improve product discovery
- Built marketing flows and campaigns to support repeat purchases
- Improved UX elements aimed at increasing AOV
We’ve worked with some of the best companies.
See how it works
Get a Demo
Request access to a sample Starter dashboard and see how it highlights conversion issues, funnel drop-offs, and revenue leaks using dummy data.
FAQs
This may help convince you to start earning where you’re now losing.
How is this different from a normal GA4 or Looker Studio dashboard?
GA4 and dashboards show data, but you still need to know what to look for. Leakoniс turns ecommerce data into clear issues, severity levels, and revenue leak signals, so you can see what needs attention first.
Do I need GA4 to be connected to BigQuery?
Yes. Leakonic needs GA4 data in BigQuery so the analysis can work properly. Your store should already have ecommerce data collected, such as sessions, product views, checkout events, purchases, and revenue. If you do not have this setup yet, that is not a problem. I can help you connect GA4 to BigQuery and prepare the data before running the analysis.
Is this a dashboard, an audit, or a software product?
Leakonic is a ready-to-use ecommerce analytics system that combines data analysis with a Looker Studio report. It is not just a static dashboard and not only a one-time audit. You get a structured way to find ecommerce issues, revenue leaks, funnel drop-offs, and underperforming areas using your own GA4 and BigQuery data.
How technical do I need to be?
You do not need to write code or build dashboards manually. The BigQuery script and Looker Studio report are already prepared. You only need to follow simple steps: copy the script, run it in BigQuery, copy the report template, and connect your data source. If you prefer, I can also help with the setup.