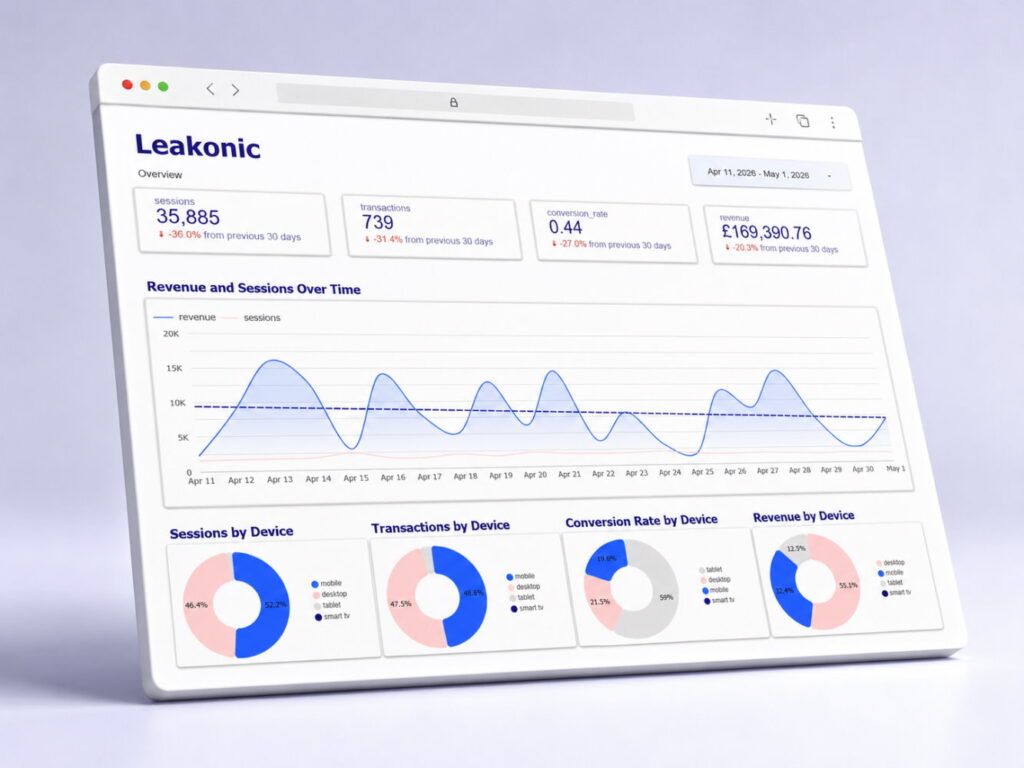


eCommerce Data Insights Template (Scale)

One-time payment

Instant access

Insights, not graphs

Reusable package

Find why conversion drop
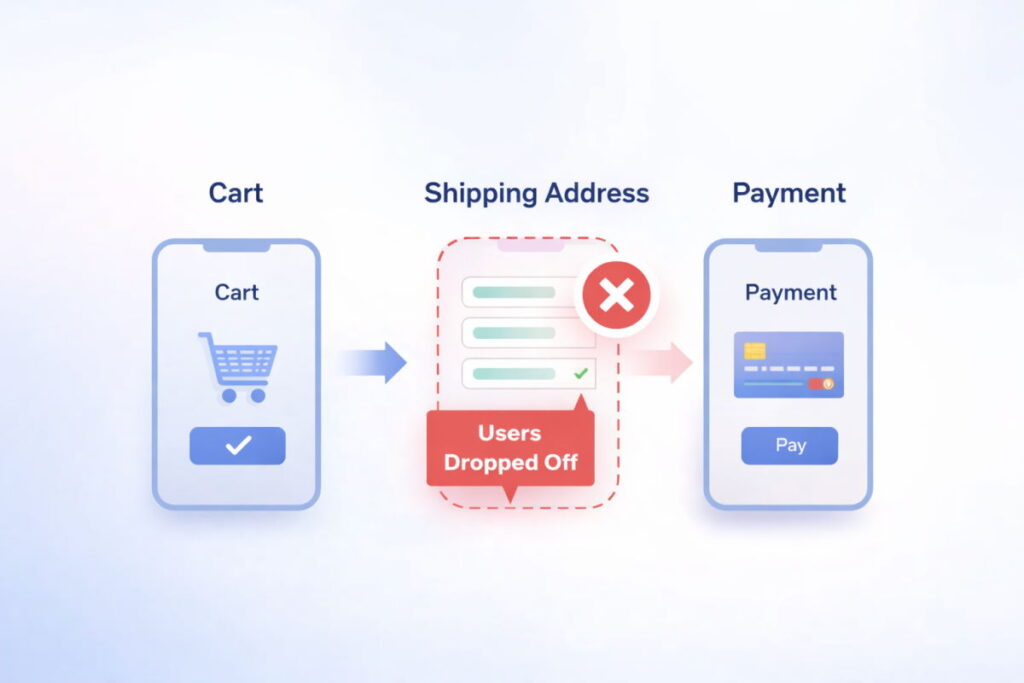
Identify frictions in your funnel in minutes

Spot revenue leaks
See where you’re losing money, where, and why

See device performance
Identify a leaking step and device of

Get a ready-made dashboard
Connect your data & get instant insights
eCommerce performance
Leakonic Premium is an advanced ecommerce insights report template that helps online stores uncover revenue leaks across funnels, products, categories, SEO, and Google Ads in one Looker Studio dashboard. Built for GA4, BigQuery, Google Search Console, and Google Ads data, it turns raw ecommerce performance data into clear leak signals, lost revenue estimates, and actionable priorities.

No coding needed

Get insights, not numbers

Compare device funnel performance
You will get:
- Google Data Studio (Looker Studio) dashboard report template
- Google BigQuery SQL script
- Step-by-step setup guide and documentation
You must have:
- Google Analytics 4, Google Ads, & Google Search Console
- Active BigQuery project with GA4, GSC, & Google Ads export enabled
- Google Data Studio (Looker Studio) free account

Perfect for:
Small eCommerce stores – Sites with GA4 data connected to BigQuery – Owners and marketers who need quick data analysis
Deliverables
The package includes:
- Overview
- Revenue leaks and issues
- Purchase funnel analysis
- Conversion rate by landing pages
- Product analysis
- Funnel analysis by device
- SEO analysis
- Google Ads analysis
❌ GEO analysis
Requirements
Free tools and quicks setup.

Google Analytics 4
Ensure you have the enhanced eCommerce analytics configured with event tracking, and connected to BigQuery.

Google BigQuery
Make sure you have a created BigQuery project with a GA4 dataset. Don’t forget to replace project and dataset names.

Google Data Studio
Create a free Google Data Studio account to use the dashboard. You can do it after the purchase. No configuration required.

Google Ads
Ensure you have the Google Ads configured and connected to BigQuery. Collect at least 7 days of data.

Google Search Console
Ensure you have the Google Search Console verified and connected to BigQuery. Collect at least 7 days of data.

5-minute setup
You can run the script and connect your data to the dashboard on your own. No coding required. Or we can do it for you.
Product & category analysis
Product and category analysis shows where customer interest is not converting into revenue. It helps identify popular products with weak purchase rates, underperforming categories, and strong sellers that may still be losing sales, allowing you to prioritize the areas with the highest potential for growth.
Product interest
Users are highly interested


128K
Views

96K
Views

112K
Views
→

Number of Sales
Sales are much lower than interest

320
Sales
210
Sales
180
Sales
→
Insights
Meaningful insights to take action

High views, few sales
Big interest, but sales aren’t keeping up

Categories with low conversion
Specific categories convert poorly

Top sellers with hidden revenue leakage
Top products may still be losing revenue
Organic clicks
12.6K
↓8.4%
Clicks lost
1.2K
↓15.7%
Top SEO issues
Ranking drops
156
CTR drops
128
Cannibalization
62
Dropped queries
186
↑6.2%
Traffic drop
1.2K
↓11.2%
Top Losing queries
keyword 1
-320
keyword 2
-146
keyword 3
-62
SEO analysis
Identify ranking drops, CTR Issues, traffic losses, and keyword cannibalization that are holding site back in search results.
- Top losing queries
- Top losing pages
- CTR, ranking, and traffic drop detection
- Impression loss opportunities
- Keyword cannibalization insights
Google Ads analysis
Spot wasted spend, campaigns with no conversions, rising CPA, and low ROAS so you can scale what works and cut what doesn’t.
- Spend with no conversions
- CPA increase and low ROAS detection
- Wasted spend by leak type
- Campaign performance overview
Add spend
$2,654.18
↓6.4%
Conversions
156
↑6.2%
Wasted spend by leak type

ROAS
186
↓12.7%
Wasted spend
$412.34
↓11.2%
Campaigns with no conversions
Brand campaign
$174
Product campaign
$212
Location campaign
$26.34
How to set up the dashboard
Set up the eCommerce dashboard template in four easy steps without coding and graph or table configuration.
1
→
Collect GA4 data
Ensure GA4 events and BigQuery export are set up.
2
→
Collect ads data
Ensure Google Ads and BigQuery export is set up.
3
→
Run analysis
Copy the provided SQL script and run it in BigQuery.
4
→
Copy report
Open the Google Data Studio (Looker) template and copy it.
5
Connect data
Connect to your BigQuery and explore insights.

Not ideal for:
Large online stores that need a fully custom BI system or businesses that want attribution modeling included.
FAQ
In case you still have questions to ask.
The Leakonic Premium package includes a ready-to-use Looker Studio dashboard structure and BigQuery SQL logic for analyzing ecommerce revenue leaks across funnel steps, device performance, product issues, category issues, SEO performance, keyword cannibalization, CTR drops, ranking drops, traffic drops, and Google Ads budget leaks.
This ecommerce insights report template is designed for ecommerce businesses, SEO specialists, marketing teams, ecommerce managers, and agencies that want to turn GA4, BigQuery, Google Search Console, and Google Ads data into actionable optimization insights.
The package is built around GA4 BigQuery export, Google Search Console BigQuery data, and Google Ads BigQuery transfer data. Looker Studio is used to visualize the final tables created in BigQuery.
Yes. Leakonic Premium is designed for stores that already use, or are ready to use, BigQuery. The SQL logic creates structured reporting tables that are then connected to Looker Studio.
Basic BigQuery and Looker Studio knowledge is recommended. You do not need to write the SQL from scratch, but you should be able to replace project and dataset names, run SQL scripts, and connect output tables to Looker Studio.
It helps identify where users drop off in the purchase funnel, which devices lose the most revenue, which products get interest but fail to convert, which categories may have weak purchase intent, which organic search queries are losing clicks, where keyword cannibalization appears, and which Google Ads campaigns may be wasting budget.

Start finding revenue leaks today
No widget configuration. No coding needed. No subscriptions.

Secure checkout
Related Dashboards
-
eCommerce Analytics Dashboard Template (Starter)
Price range: 79,00 € through 129,00 € -
eCommerce Report Template (Growth)
Price range: 159,00 € through 199,00 €